Output of TRAPP-analysis
Analysis of protein flexibility
The analysis results can downloaded in an archive by clicking on the Trapp Analysis data link. This contains folders for each method used and a folder for the clustering representatives. The folders contain raw data files (.dat), structure representative files (.pdb) and plot files (.png).
Analysis includes:
- Computing of RMSD of the binding site residues in generated/uploaded structures from those in the reference structure
- Clustering of the binding site conformational variations in generated/uploaded structures
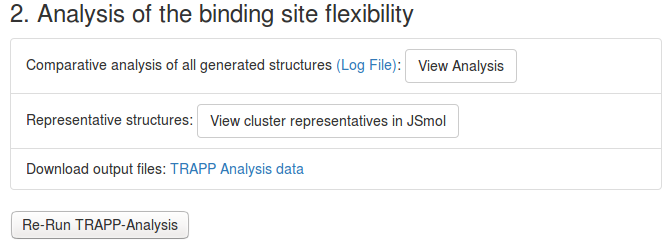
Two links are provided:
- View Analysis: To HTML page with results of analysis of the binding site flexibility in generated/uploaded structures
- View cluster representatives in JSmol: To PDB structures of the cluster representatives
View Analysis: (HTML page trapp_analysis-bb.html or trapp_analysis.html) contains:
- Deviation of the binding site conformations from the reference structure:
- Clustering of the binding site conformations:
- List of the cluster representatives:
- Single-linkage hierarchical clustering:
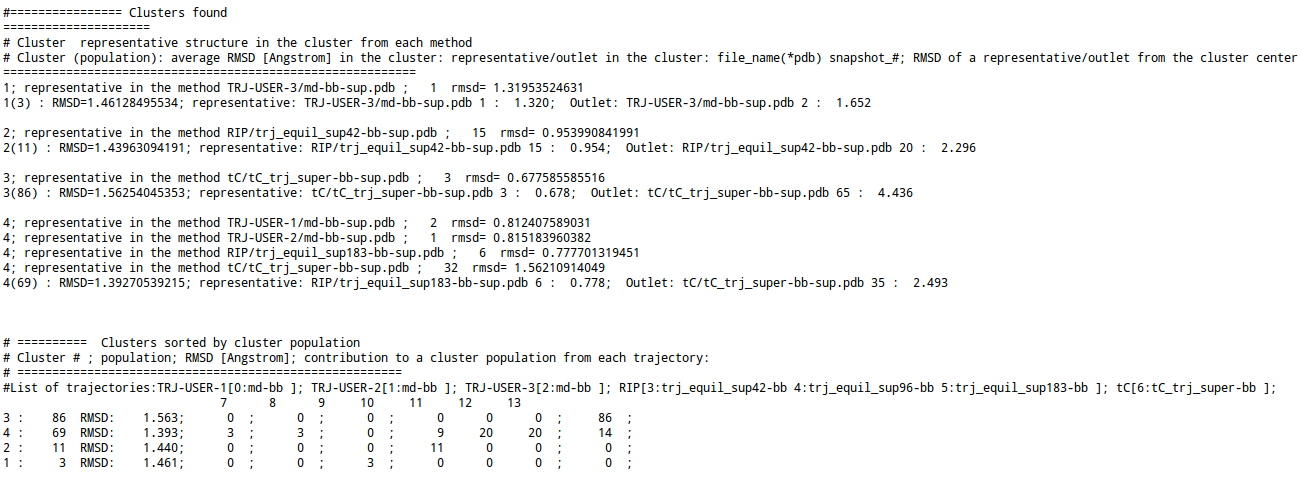
- For k-means clustering, the following information is provided:
- a representative as well as an outlet structure of each cluster selected from all trajectories/snapshots ; RMSD (in Å) of the binding site for the representative and for the outlet, and averaged over all of the clusters
- a representative structure found in each uploaded trajectory or in trajectories generated by each method for each cluster (the name of the trajectory and the number of the frame start from 1).
- a list of clusters ordered by their population; the number of cluster members from each trajectory/ensemble is given
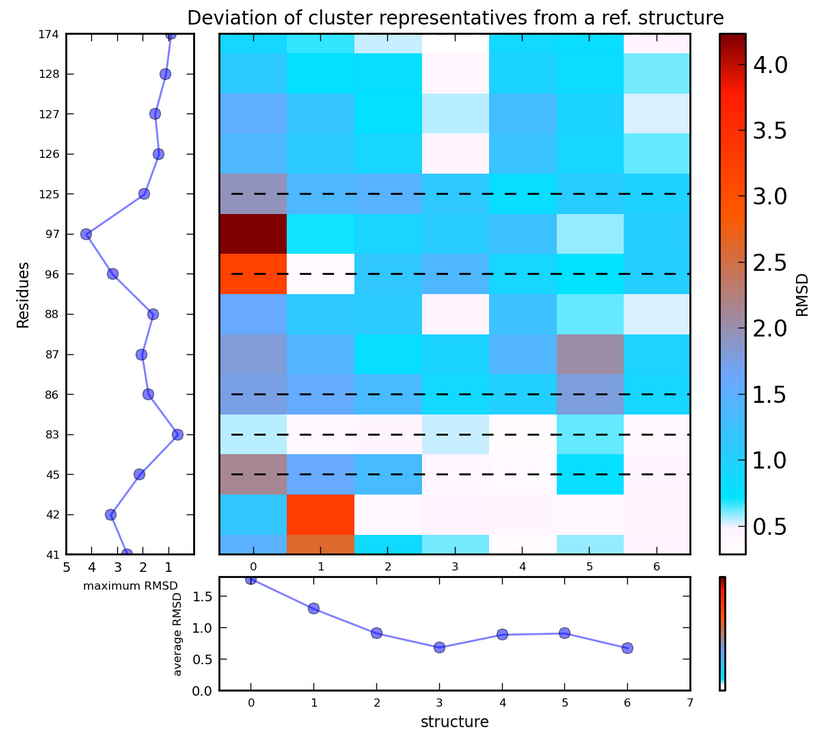
RMSD of the binding site residues (either backbone atoms or geometric centers of residues, see input for TRAPP-analysis) from those in the reference structure is shown by a 2D image matrix (residue vs snapshot) for each trajectory separately. For L-RIP/RIPlig, plots are also generated for all trajectories together.
Each element of the matrix corresponds to the deviation of a particular residue in a particular snapshot from that in the reference structure. Note that the maximum deviation shown can be defined by the user (see TRAPP-analysis input).
Average RMSD values of all binding site residues in each snapshot are shown as a horizontal 2D plot, and maximum RMSD for each residue is shown by a vertical 2D plot on the left-hand side of the matrix.
There is an image button under each plot that enables downloading of the data file used for plot generation. The first column contains the residue number (counted from the first residues in the reference structure); The last column contains the maximum RMSD for each binding site residue. The last row contains the RMSD in each snapshot averaged over all binding site residues.
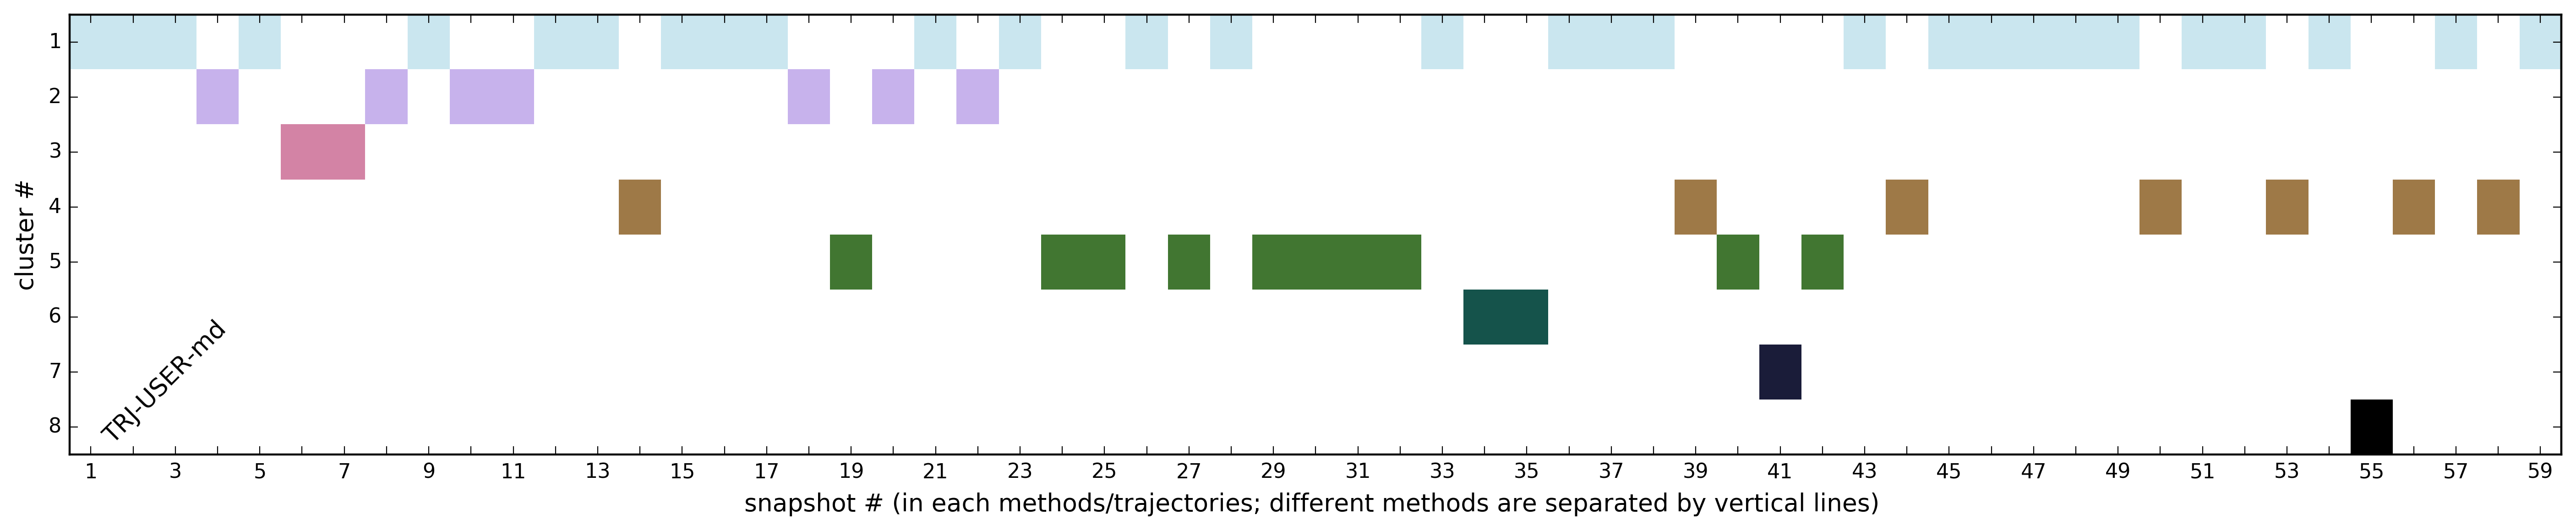
Fig.3 illustrates the distribution of snapshots among clusters.
The clustering procedures are based on the maximum value of the RMSD of the binding site residues from the reference structure. A file with all cluster parameters is provided by a link List of the cluster representatives
The form of the file depends on the method used for clustering:
The file contains representative structures for each cluster found in each uploaded trajectory and/or in trajectores generated by a particular method (the name of the trajectory and the number of the frame starting from 1).

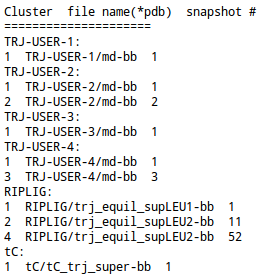
RMSD of the cluster representative structures from the reference structure (only k-means clustering)
Get PDB: Enables downloading of the structures of cluster representatives (see details in the View Analysis HTML page)
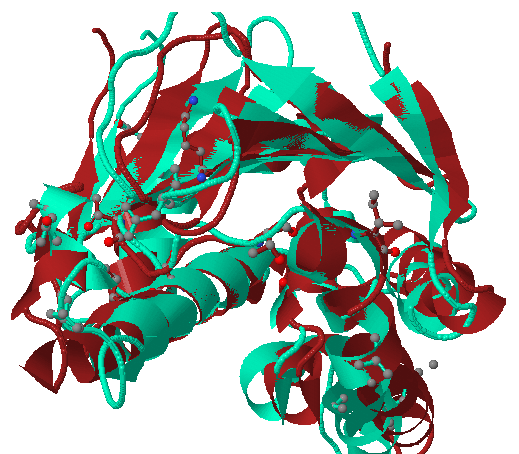
View cluster representatives in JSmol: (only k-means clustering) Enables visual comparison of the cluster representatives with the reference structure;(only k-means clustering).
The red cartoon represents the reference structure, the green cartoon represents the cluster representative and binding site residues (chosen using a pocket radius) are shown by sticks.