Differentiating binding pocket features using a multiple sequence alignment
Binding pocket characteristics and a multiple sequence alignment are used to compare human and parasitic forms of dihydrofolate reductase (DHFR).
1. Overview
Dihydrofolate reductase (DHFR) is a key enzyme in the folate pathway and DNA synthesis. It is both a target for anti-cancer antifolate drugs and a potential target for drugs against human trypanosomatid parasites. Selectivity of trypanosomatid DHFR against human DHFR is difficult to achieve due to their very similar binding pockets. This problem can be addressed by analysing the binding site flexibility. In particular this example focuses on the DHFR of Trypanosoma cruzi, a human parasite that causes Chagas' disease. This example is fully explained in Stank et al.
2. This example requires the following files:
- DHFR_ref.pdb
- DHFR_lig.pdb
- DHFR_structures.tar
- DHFR_msa.fasta
The reference structure (3cl9 pdb file, containing only the protein with H atoms added)
The ligand file (the bound ligand, methotrexate extracted from 3cl9 PDB file, used to define the binding site)
27 protein structures, produced from a single protein chain of several PDB crystal structures.
5 DHFR sequences in the FASTA format representing the sequences of trypanosomatid on-targets, UniProt: Q27793, Q27783, P07382, Q8MQV3, E9B8U9 and the sequence for the off-target human DHFR with Uniprot: P00374
3. Simulation Procedure and Results
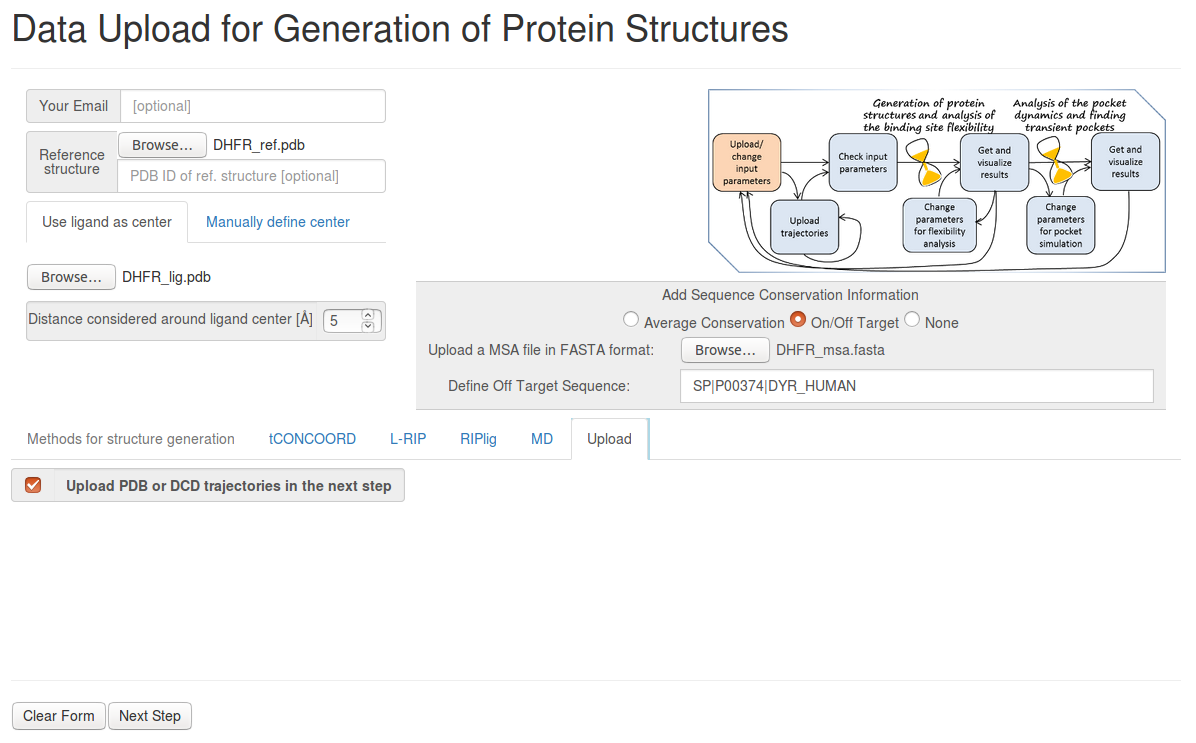
- Step 1: Uploading the reference structure, ligand file and MSA information
Upload the reference structure and ligand file, selecting 5Å for Distance considered around ligand center.
Click on On/Off Target in the box entitled Add sequence conformation information. Upload the MSA FASTA format file and select the header of the off-target sequence ( SP|P00374|DYR_HUMAN ).
Then click Upload PDB or DCD trajectories at the next step as a method, before you go to the Next Step
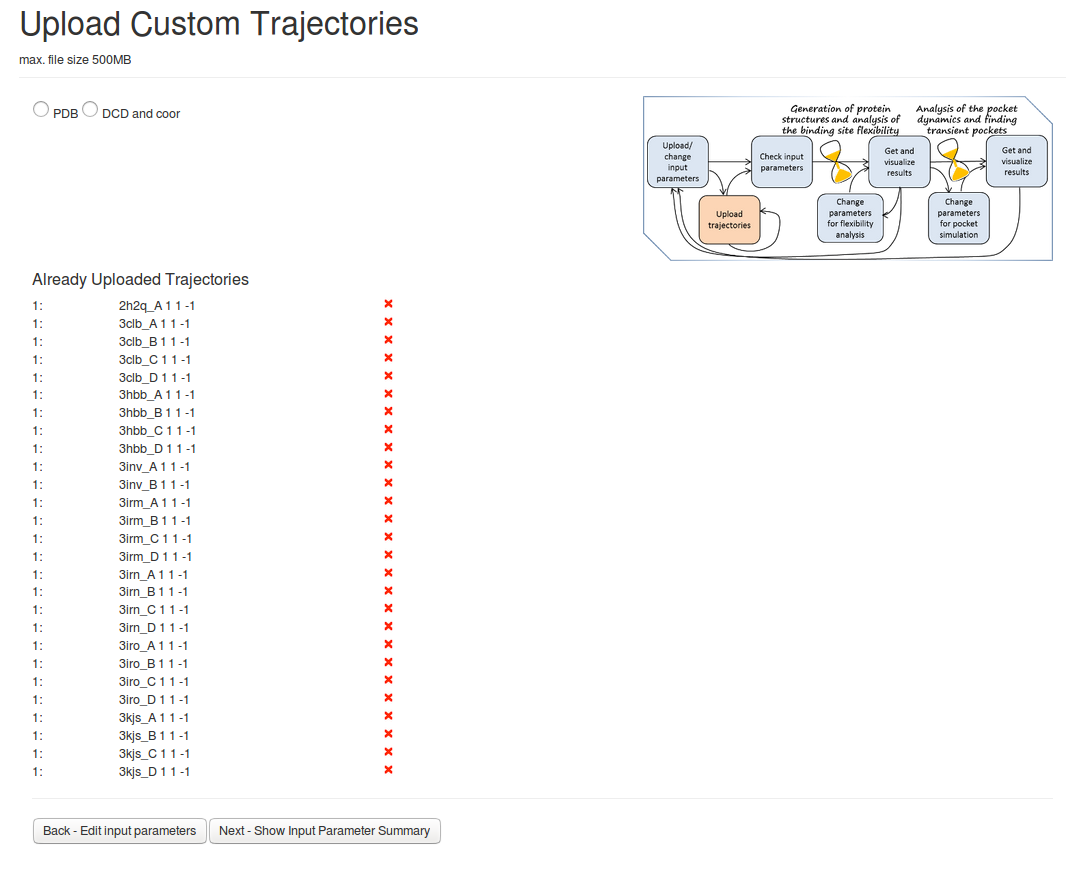
- Step 2: Uploading PDB files
On the next page Upload Custom Trajectories You can then upload the PDB filesby pressing PDB, Upload trajectories and then Next-Show Input Parameter Summary.Analysis of the uploaded PDB files will be done, as no method of generating new structures was selected. (see Fig.2)
- Step3 : Checking input data and starting simulations
On the page entitled Pocket analysis will be started with the following parameters:, you must be able to see a JSmol visualization of the reference structure and an identified binding pocket. - Press the button Launch TRAPP structure/analysis.
- Step4: Viewing initial results of TRAPP-Analysis and running K-means clustering
When the job has completed you can open a page, View Analysis, containing the preliminary results of the TRAPP-Analysis procedure. The default parameters of the TRAPP-Analysis have been used at this step.
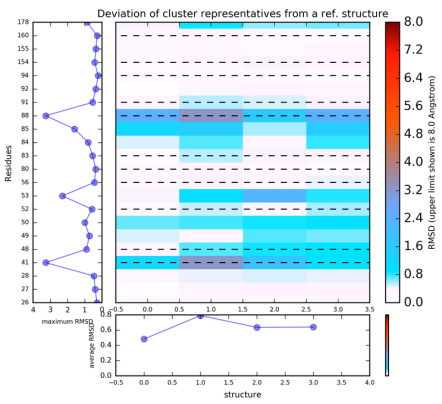
You can then run K-means clustering by clicking Re-run TRAPP-Analysis, and then selecting do k-means clustering , Maximum value of deviation to be shown in plots as 1.5 Angstroms and Geometric centers of each residue
The results of this will be found when View Analysis is clicked. The results show that the residues Ile41, Arg53, Pro85 and Phe88 have the greatest variability.
- Step5: Running TRAPP-Pocket and viewing the simulation and MSA results
Click Run TRAPP-Pocket followed by Launch TRAPP-Pocket on the following page, so that TRAPP-Pocket will run with the default parameters.
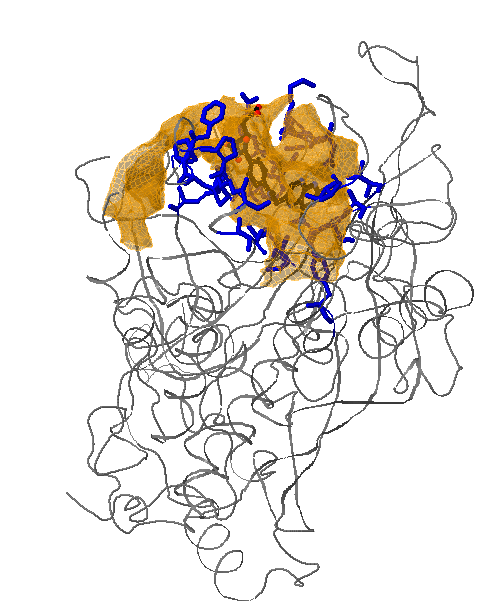
Select the checkbox Show conservation, to colour the reference structure according to the per-residue differential sequence conservation. This gives a blue colour for conserved residues and a red colour for residues that are not conserved between the on and off-target sequences.
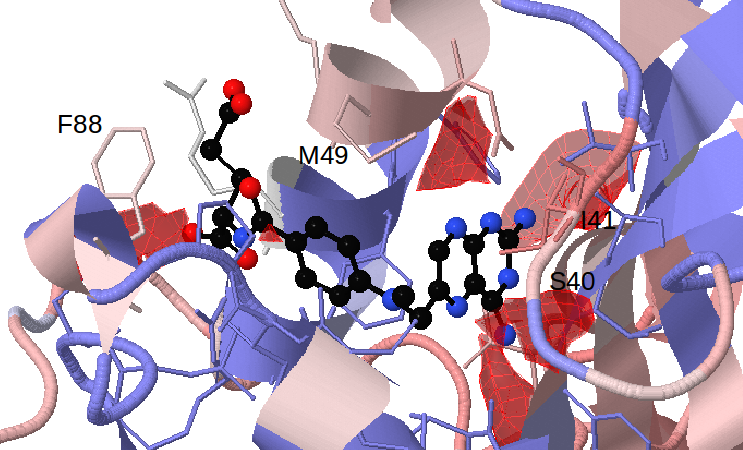
Select 50% for Appearing pockets. The red isocontours that appear show the opening of small sub-pockets near Ser40/Ile41, Met49 and Phe88. (see Fig.5)
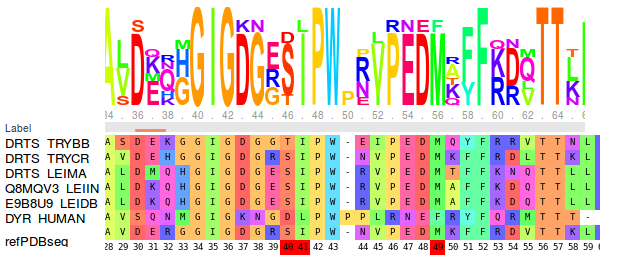
Viewing the MSA shows that there is full conservation of amino acid positions 41, 49 and 88, and partial conservation of position 40 between the representatives of trypanosomatids. However the colouring shows that these positions differ from the human DHFR in terms of size or charge. Met49, Phe88 and Ser/Thr40 in parasite DHFR are exchanged to Phe, Asn and Asp in the human DHFR respectively. (see Fig.6)
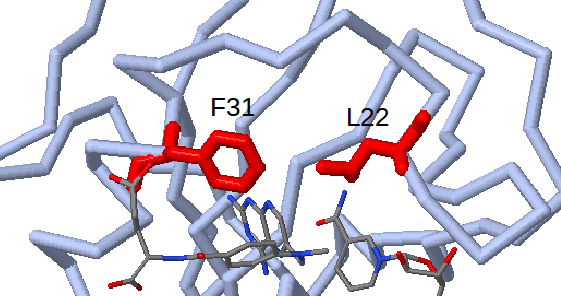
Furthermore, the ProSAT+ tool can be used to show that residues Ile41 and Met49 (Leu22 and Phe31 in human DHFR) which are identified as flexible, non-conserved and close to the appearing sub-pocket, are known mutagenesis sites in human DHFR (Leu22 to Arg and Phe31 to Arg) which affect catalytic activity and the binding affinity of methotrexate. (see Fig.7)